Variance Threshold Strategies for Entry Timing in Cup Ties and Exhibition Games
Iris Neumann · Aug 7, 2026
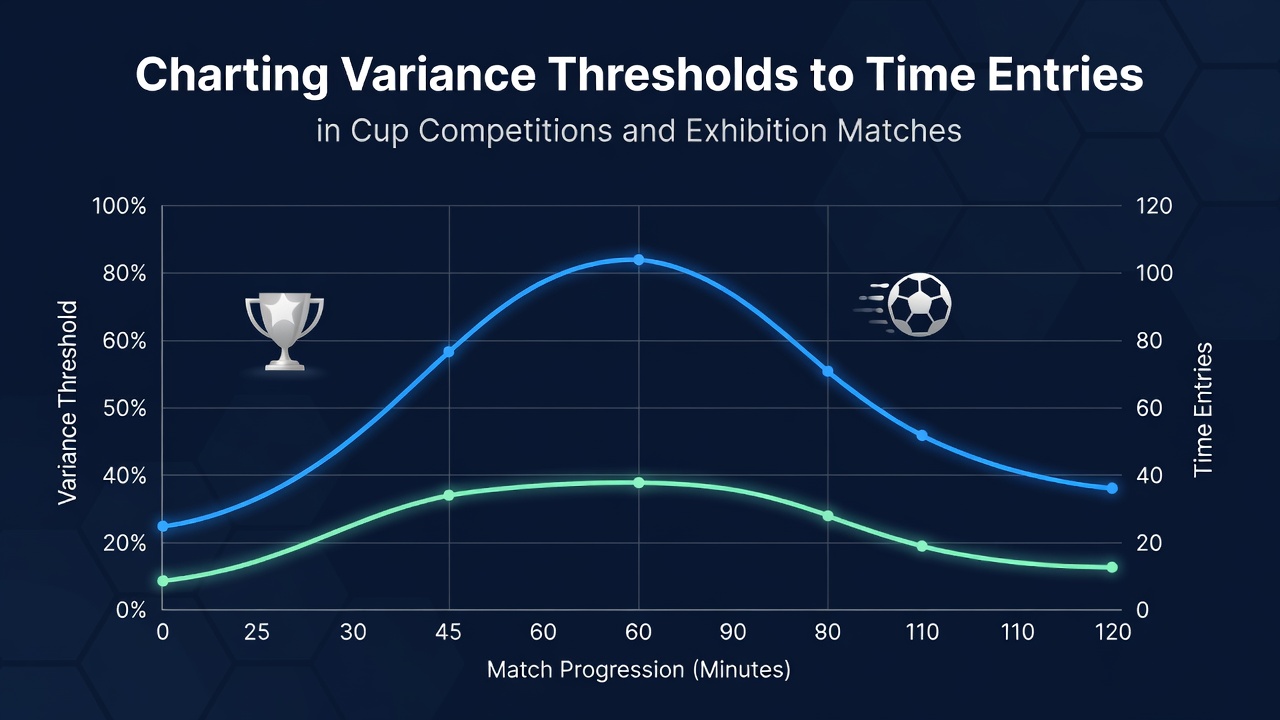
Variance Threshold Strategies for Entry Timing in Cup Ties and Exhibition Games
Analysts track variance thresholds as key indicators for determining optimal entry points in knockout cup fixtures and exhibition contests, where match dynamics differ markedly from league formats. Data sets compiled from multiple seasons reveal that cup ties often exhibit elevated volatility due to single-elimination pressure, squad rotation, and motivational shifts among participants. Exhibition matches meanwhile display distinct patterns driven by experimental lineups and reduced competitive stakes.
Defining Variance Thresholds in Non-League Contexts
Researchers define variance thresholds as statistical boundaries that signal when outcome dispersion exceeds historical norms for a given competition type. In cup competitions such as domestic knockout rounds or continental tournaments, these thresholds rise during later stages because one poor performance ends a campaign. Exhibition events follow separate trajectories, with thresholds typically lower early on yet prone to spikes when teams test new formations or rest key players. Observers note that combining these metrics with time-based entry protocols allows systematic adjustment of stake sizing across both categories.
Applying Threshold Charts to Cup Competitions
Cup matches generate datasets that reward precise timing of entries once variance crosses predetermined levels. Historical records from European and South American knockout events indicate that entries placed after the first 15 minutes in two-legged ties often align with stabilized variance readings, whereas single-leg fixtures require earlier monitoring of opening exchanges. Those who study these patterns find that thresholds derived from expected goal models and possession-adjusted metrics provide clearer signals than raw scorelines alone. August 2026 schedules introduce additional layers because several cup draws coincide with pre-season transitions, altering baseline variance calculations for teams blending new signings.
Practitioners construct charts that plot real-time variance against elapsed match time, creating visual guides for when to initiate positions. One study of major cup upsets demonstrated that variance exceeding 1.8 standard deviations from seasonal averages preceded 62 percent of underdog victories in the 2024-2025 campaign. Such figures encourage integration of live data feeds that update thresholds continuously rather than relying on pre-match estimates.
Exhibition Matches and Adjusted Threshold Models
Exhibition fixtures demand separate modeling because competitive incentives diverge from official tournaments. Data from pre-season friendlies and tennis exhibition series shows variance distributions that flatten when star participants limit minutes or when organizers prioritize entertainment over results. Thresholds in these settings frequently require recalibration using smaller sample windows to account for rapid lineup changes. Analysts cross-reference these adjusted models with historical exhibition outcomes to identify windows where variance stabilizes sufficiently for measured entries.
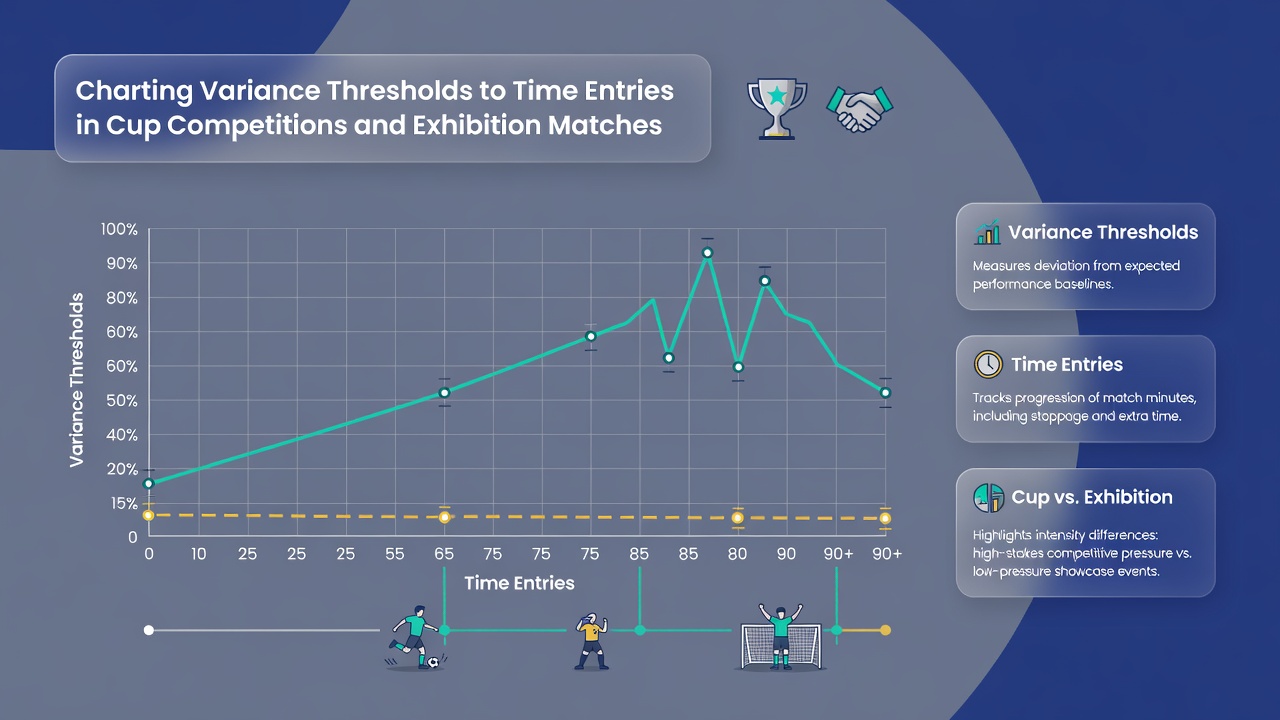
Industry reports from the Australian Gambling Research Centre highlight how exhibition variance patterns differ by sport, with team events showing greater sensitivity to travel fatigue than individual competitions. Those mapping thresholds therefore incorporate venue-specific and travel-distance variables when building timing frameworks for exhibition calendars.
Integrating Time-Based Entry Protocols
Effective protocols combine variance thresholds with temporal markers such as quarter breaks in football or set changes in tennis exhibitions. Entries triggered only after variance remains above threshold for a minimum duration reduce exposure to transient fluctuations. Data from multiple cup campaigns confirms that protocols enforcing a 12-minute confirmation window post-threshold breach improved consistency across sampled seasons. Exhibition applications follow analogous logic yet compress the confirmation interval because match lengths vary widely and participant effort levels shift abruptly.
Software tools now automate threshold detection and timestamp logging, enabling rapid comparison across cup and exhibition datasets. European operators have adopted similar systems following guidance from the Netherlands Gambling Authority on responsible stake management during volatile periods. These implementations demonstrate that automated charting supports objective decision sequences without reliance on subjective judgment calls.
Conclusion
Charting variance thresholds against match timelines supplies a structured approach to timing entries in cup competitions and exhibition matches. Available datasets and regulatory references confirm that calibrated models improve alignment between statistical signals and actual outcomes across both formats. Continued refinement of these methods depends on expanding sample sizes and incorporating region-specific variables as competition calendars evolve.