Endurance Indicators and Their Role in Adjusting Lines for Prolonged Football Encounters and Tennis Marathons
Iris Neumann · Aug 14, 2026
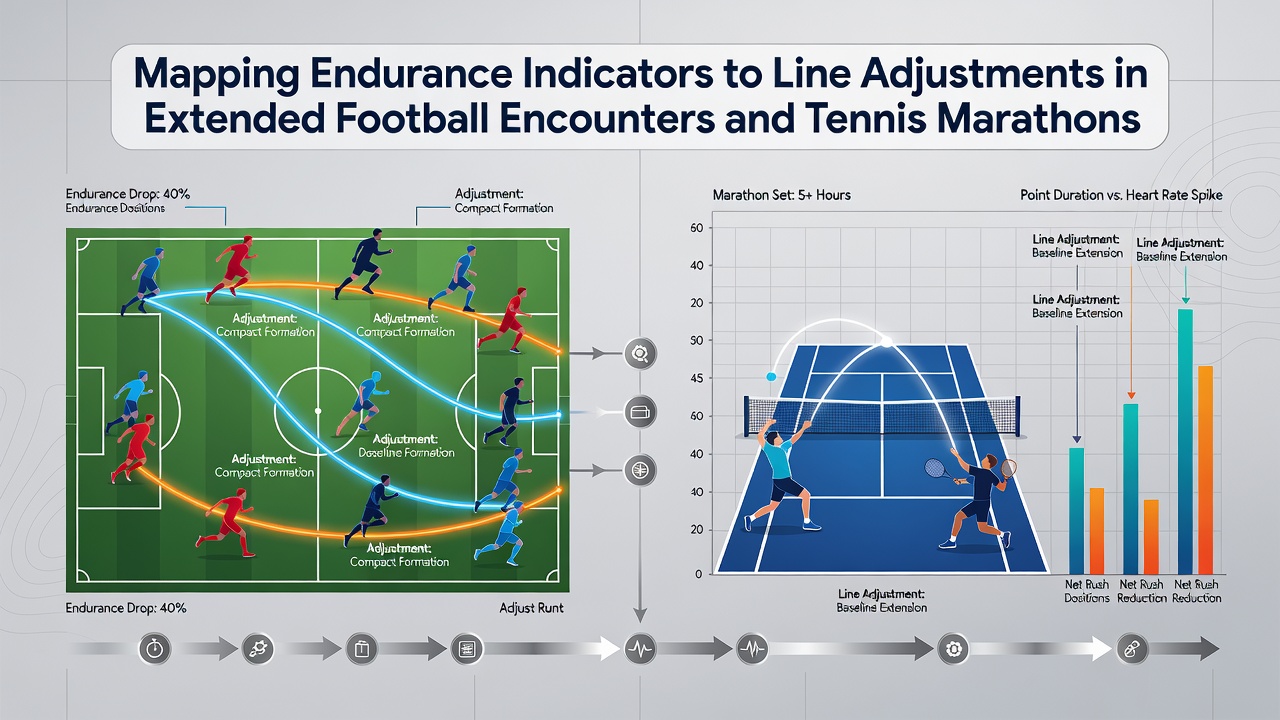
Endurance Indicators and Their Role in Adjusting Lines for Prolonged Football Encounters and Tennis Marathons
Analysts track player stamina metrics such as distance covered per minute, heart rate variability, and recovery intervals when matches extend beyond standard durations, and these measurements feed directly into real-time line adjustments on betting platforms. Data collected during extra-time periods in football or fifth-set battles in tennis reveals consistent patterns where fatigue thresholds trigger shifts in goal totals, point spreads, and over-under markets.
Core Endurance Metrics in Extended Play
Football teams that maintain higher average sprint distances after the 90-minute mark show measurable impacts on total goals scored in additional time, while tennis players whose serve speeds drop below established baselines exhibit altered hold percentages that operators incorporate into updated spreads. Studies from the Union of European Football Associations document these correlations across multiple seasons, highlighting how cumulative physical load influences both team output and market pricing.
Football Applications During Extra Time
Operators monitor GPS-tracked player loads from the opening whistle through extra time, then recalibrate lines when aggregate fatigue scores exceed predetermined benchmarks. For instance, matches reaching the 105th minute often see goal-line totals lowered by 0.25 increments when both sides display elevated lactate thresholds, according to performance data aggregated from major European leagues. Teams with deeper bench options maintain steadier endurance profiles, prompting smaller line movements compared to squads relying on fewer substitutions.
What's interesting here is how these adjustments occur in layered stages rather than single jumps. Early extra-time lines reflect baseline fatigue from the first 90 minutes, but subsequent updates incorporate live heart-rate telemetry and acceleration counts that become available through broadcast partnerships. Observers note that markets stabilize once one team establishes a clear stamina advantage, typically around the 115-minute mark.
Tennis Marathons and Set-Based Adjustments
Tennis encounters that stretch past three hours introduce distinct endurance variables centered on serve consistency and rally length. Research published by the International Tennis Federation shows that players maintaining first-serve percentages above 62 percent in deciding sets receive favorable line adjustments on game totals, whereas those experiencing velocity declines see over lines contract as bookmakers anticipate fewer service holds. Grand Slam data from recent seasons indicates that five-set matches produce line shifts averaging 1.5 games once the fourth set concludes.
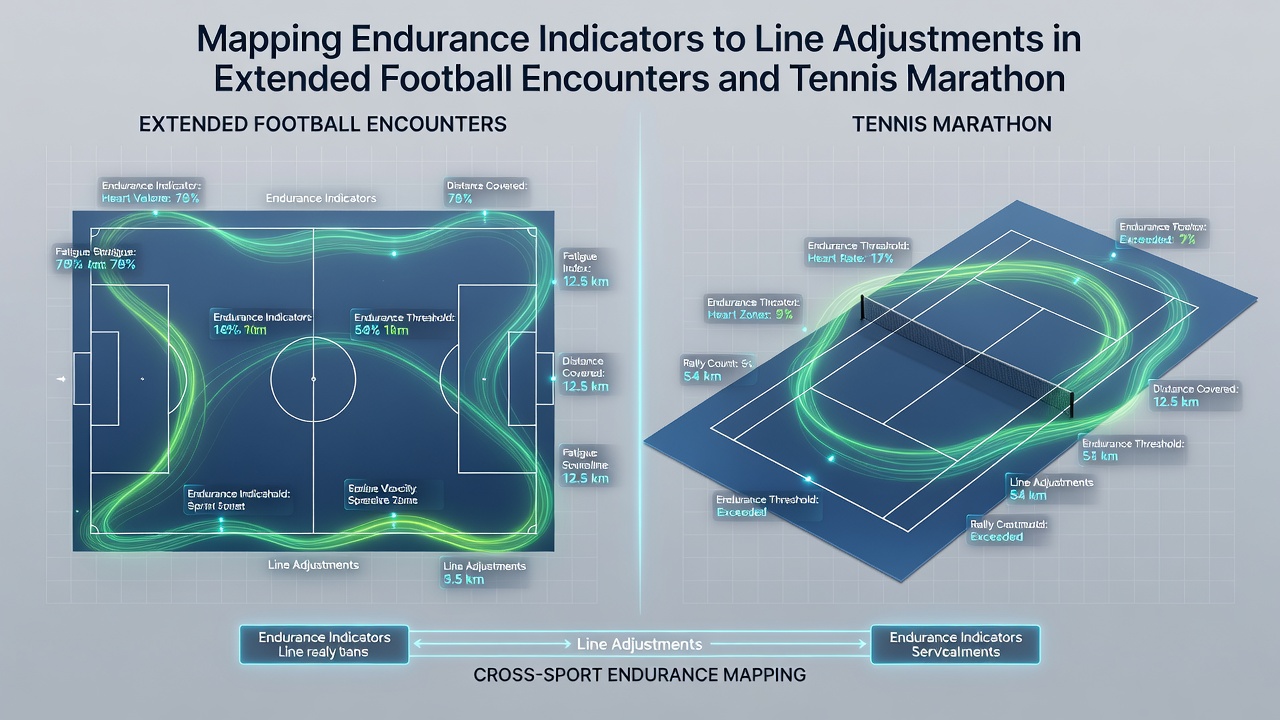
Coaches and analysts feed these indicators into proprietary models that operators reference when balancing risk across correlated football and tennis positions. A single player’s rally endurance score can influence not only individual match lines but also related prop markets such as total points in the final set. Markets respond more aggressively in best-of-five formats because historical win rates diverge sharply once physical depletion sets in after four hours of play.
Integration of Data Streams for Line Updates
Multiple data providers now supply synchronized feeds that combine optical tracking with wearable sensor outputs, allowing platforms to refresh lines every 30 seconds during extended play. These streams capture variables including stride frequency, court coverage efficiency, and recovery time between points, all of which map onto probability models used for dynamic pricing. As of August 2026, several major tournaments have expanded access to these datasets through official partnerships that standardize reporting formats across venues.
Lines move in smaller increments when endurance signals remain within historical norms, but they widen when outliers appear, such as unexpected drops in acceleration counts during extra time or prolonged baseline exchanges in tennis. The process relies on algorithms that weigh recent performance against season-long stamina baselines, producing adjustments that reflect cumulative rather than isolated fatigue events.
Cross-Sport Correlations and Market Responses
Portfolio strategies sometimes combine football extra-time totals with tennis deciding-set overs because both respond to similar endurance depletion patterns. When one market shows contraction due to elevated fatigue scores, operators may offset exposure by tightening lines in the correlated tennis fixture. Reports from the Australian Sports Commission note that such paired adjustments have increased in frequency as real-time data availability improves across both codes.
Those who study these mappings find that line stability returns once a clear endurance leader emerges, typically after the first goal in extra time or the first service break in a fifth set. Subsequent movements become smaller because remaining stamina differentials have already been priced in. The ball’s in the market’s court once these thresholds are crossed, and further updates depend on live events rather than pre-match projections.
Conclusion
Mapping endurance indicators to line adjustments provides operators with a structured method for responding to the physical realities of extended football and tennis contests. The approach draws on verified performance data that updates continuously, allowing lines to reflect actual stamina conditions rather than static assumptions. As tracking technology advances, these correlations are expected to grow more precise across additional competitions and formats.